Forecasting a childcare network centre by centre
A childcare operator had attendance, fee and financial records across several centres and planned to add locations over time. The budget needed to connect each site’s capacity, occupancy ramp, service mix and property path to staffing, direct costs and group cash.
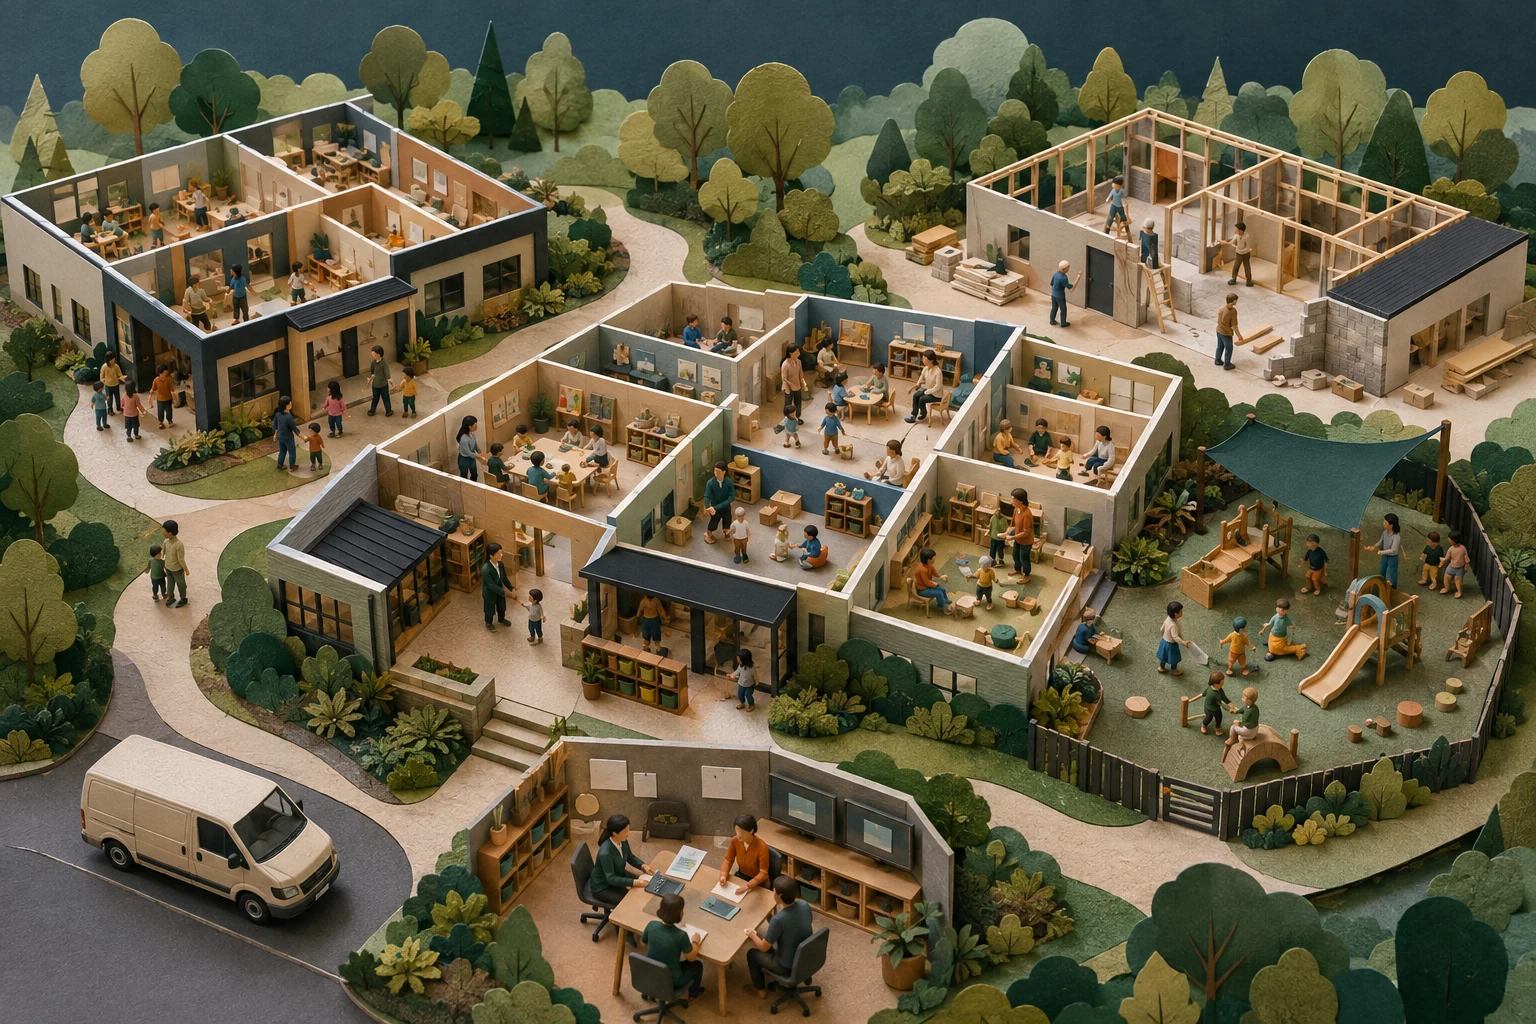
Attended sessions and available places roll into centre occupancy before the forecast is compared with actuals.
Each location retains its own capacity, opening schedule, service mix and occupancy ramp.
Volume and fee performance remain separate, so a revenue variance can be traced to operating activity.
Facility choices affect operating expense, investment, insurance and cash on different timelines.
WHY THIS WASN’T A TEMPLATE EXERCISE
The model had to respect
how the business actually moved.
The reconstructed architecture starts with weekly attendance and fee records, calculates centre-level occupancy and revenue, then layers opening ramps, payroll, facilities, fleet and overhead into centre and group views.
The operating data and the budget used different grains
Attendance was captured by centre, room, weekday and week, while fees and the profit-and-loss were summarized on other calendars. The model first needed a reliable bridge from detailed activity to comparable monthly actuals.
Network occupancy was not one percentage
Centres had different capacities and service mixes. A single group occupancy assumption would conceal which location or program created a revenue variance and which still had room to grow.
A new centre changed costs before it reached steady use
Staffing, management, premises, utilities, insurance and launch expenses could begin before a site reached planned occupancy. Each opening therefore needed its own activation and ramp schedule.
Property and fleet questions crossed financial statements
Renting or owning a site, insuring buildings and vehicles, and separating transport activity affected more than one expense line. Those choices needed schedules that could feed profit, cash and the balance sheet consistently.
MODEL ARCHITECTURE
From operating activity
to a decision-ready view.
Each layer has one job. Together they keep the commercial story, unit economics and cash consequences on the same timeline.
Historical activity
Weekly attendance, available places, fees, service categories and financial actuals are normalized to a shared centre and period structure.
Capacity and occupancy
Attended sessions are compared with available places for each centre and month before results are consolidated.
Service mix and yield
Program activity, fee levels and realized revenue per operating period explain how centre occupancy converts into revenue.
Opening schedule
Each current or planned centre receives its own launch gate and occupancy ramp, changing the number of active sites over time.
People and direct costs
Wages, employer costs and child-linked supplies follow centre activity and remain comparable across actual and forecast periods.
Facilities, fleet and insurance
Property choices, rent, investment, vehicles and insurance sit in separate schedules with site-specific timing.
Centre and group results
Centre and service views reconcile to the network profit-and-loss while preserving shared management and overhead.
Rolling statements and review
Date-driven actuals and forecasts extend into cash, balance-sheet and management views without rebuilding the model each year.
WHAT THE ANALYSIS SURFACED
Useful answers,
without exposing client data.
The takeaways are intentionally qualitative. Exact assumptions, calculations and outputs remain inside the confidential client model.
Revenue variance began with occupied places
A top-line shortfall could come from attendance, available capacity, service mix or fee yield. Separating those drivers made the source of the variance visible before management changed a forecast rate.
The labour ratio needed one consistent definition
Actual and budget periods were only comparable when wages and related employer costs used the same revenue basis. Otherwise, apparent efficiency could be a classification difference rather than an operating change.
Expansion created a stair-step cash profile
A planned centre could add premises, people and overhead before its occupancy ramp matured. Testing the launch date and ramp together showed why growth and near-term cash could point in opposite directions.
Rent or buy changed more than the rent line
The property path altered investment timing, insurance, financing and balance-sheet treatment as well as operating expense. Keeping the choice outside a single profit-and-loss cell made the comparison more complete.
MODELING APPROACH
The working system
behind the answer.
- Historical attendance, capacity, fee and financial-data bridge
- Centre-level occupancy and revenue-variance schedule
- Service-mix, fee-yield and weekly revenue drivers
- Phased centre-opening and occupancy-ramp model
- Payroll, employer-cost and child-linked direct-cost schedules
- Rent-or-own, property, fleet and insurance modules
- Centre, service and consolidated profit-and-loss views
- Rolling statements, cash, dashboard and expansion scenarios
CASE CONFIDENTIALITY
This anonymized case explains the childcare network’s occupancy, expansion and cost logic without naming the operator, owners, centres, services, people, jurisdiction or dates. Exact capacities, attendance records, fee data, wage ratios, rents, property choices, vehicle costs, insurance assumptions, forecasts and reported figures remain private because client work can be confidential or NDA-protected. No source workbook, branded screenshot, formula, logo or identifying interface is reproduced. The illustration is an original fictional centre network rather than a real facility, floor plan, staff group, child, client deliverable or operating result.