Connecting forestry fleet growth to deployment economics
An equipment-intensive forestry-services operator was shaping an acquisition-led growth platform. The forecast needed to connect public-agency rate bands, seasonal deployment, crew and transport requirements, fleet investment, financing and investor distributions without letting any one assumption float alone.
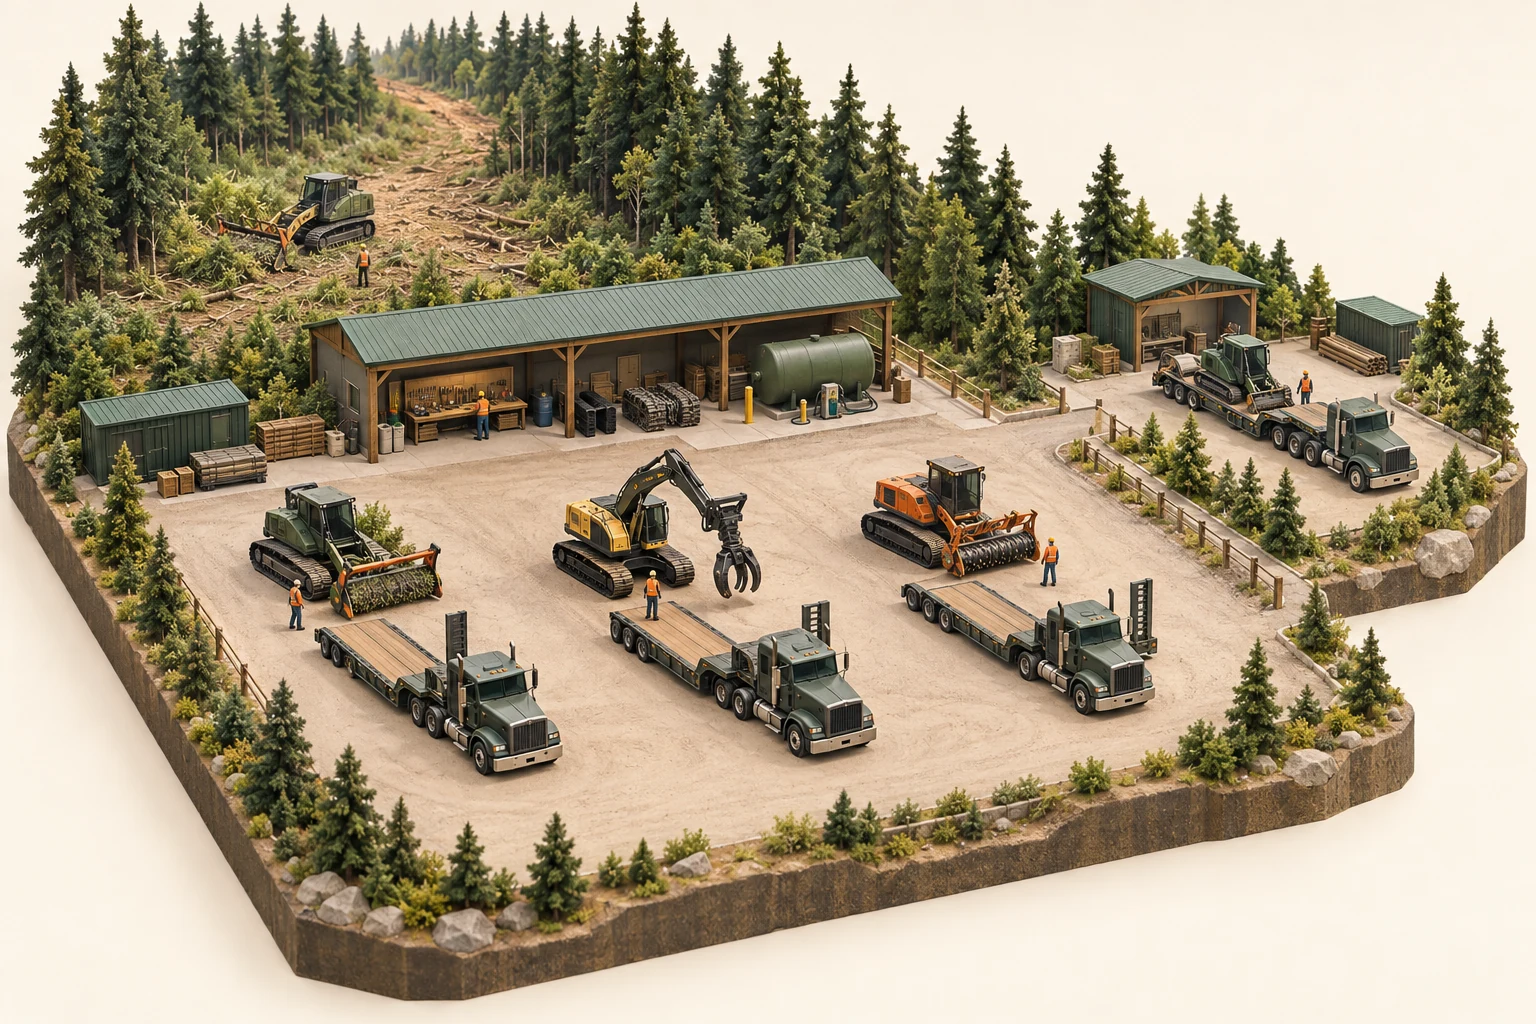
Equipment, active days, shift mix and applicable rate bands build revenue before it is consolidated.
A deployed unit carries its operators, transport support and activity-driven operating costs with it.
Pricing floors and billable-activity thresholds test whether another unit can support itself.
Fleet investment, debt service, reserves and investor distributions compete on one timeline.
WHY THIS WASN’T A TEMPLATE EXERCISE
The model had to respect
how the business actually moved.
The reconstructed architecture links units, deployment and rate bands to operators, transport, operating costs, acquisitions, debt, cash reserves and an investor waterfall—making pricing floors and viable fleet scale visible.
Billing bands and labor did not move in lockstep
Public-agency work could move between guaranteed-day and extended-service rate bands, while operator pay followed its own overtime curve. Revenue and labor therefore had to respond to the same deployment without being reduced to one blended hourly assumption.
One machine was more than one asset
A deployable unit could require operators, a driver, transport equipment, fuel, maintenance and mobilization. Adding machinery without that support would overstate available capacity and understate cash needs.
Seasonality made idle capital a central risk
Emergency work could concentrate activity and stronger rates into part of the year. The same fleet could face a very different utilization threshold when demand moved into the quieter operating season.
Acquisitions changed operations and capital together
Each acquired operator could add equipment and people as well as purchase consideration, debt and working-capital needs. The platform view needed to stage those consequences as a cohort rather than assuming immediate full contribution.
Growth capital and investor payouts shared the same cash
Equipment purchases, debt service, a protected reserve, discretionary distributions and exit proceeds could not be modeled independently. Their order determined how much capital remained available for the acquisition strategy.
MODEL ARCHITECTURE
From operating activity
to a decision-ready view.
Each layer has one job. Together they keep the commercial story, unit economics and cash consequences on the same timeline.
Operating calendar and scenarios
A monthly operating horizon carries seasonal deployment, service intensity and scenario controls before later periods roll into an annual view.
Fleet and acquisition cohorts
Each operating cohort brings its equipment, acquisition timing, useful life and financing into the platform on an editable schedule.
Contract and rate engine
Contract type, equipment category and service-duration band select the applicable revenue logic without burying authority-specific assumptions.
Deployment and utilization
Available units, active days and shift mix translate the fleet into billable activity while preserving downtime and quieter-season risk.
Crew and transport pairing
Operators, overtime and dedicated transport support scale from the deployed equipment set instead of from a disconnected payroll budget.
Fully loaded unit economics
Fuel, maintenance, repair reserves, insurance, mobilization and allocated overhead combine with labor to establish contribution per deployed unit.
Capital and debt schedules
Equipment purchases, replacement needs, debt draws, principal, interest and working-capital facilities reach the same monthly cash forecast.
Reserve and investor waterfall
A protected cash reserve governs discretionary distributions, while investor capital, accrued return and residual proceeds follow an explicit order.
Decision outputs
Integrated statements support pricing-floor, utilization-threshold, breakeven, fleet-scale, coverage, return and sensitivity views.
WHAT THE ANALYSIS SURFACED
Useful answers,
without exposing client data.
The takeaways are intentionally qualitative. Exact assumptions, calculations and outputs remain inside the confidential client model.
A higher billing band did not guarantee higher contribution
Longer deployments could lift the equipment rate while also changing overtime, staffing and support costs. The model therefore needed to compare incremental revenue with the full incremental resource load.
Fleet growth required paired operating capacity
A purchase became commercially useful only when operators, transport and support resources were available at the same time. Fleet count alone was not a reliable measure of deployable capacity.
The utilization threshold was also an acquisition gate
Required billable activity could show whether market demand and contract coverage justified another unit before capital was committed and fixed costs increased.
Distribution policy belonged inside the growth model
Keeping reserves and investor distributions on the same cash timeline made it possible to see whether a payout would reduce the platform’s ability to fund its next operating cohort.
MODELING APPROACH
The working system
behind the answer.
- Contract, equipment and service-duration rate architecture
- Seasonal deployment, utilization and shift engine
- Fleet and acquisition-cohort schedule
- Operator, overtime and transport-support model
- Fuel, maintenance, insurance and mobilization costs
- Fully loaded rate-floor and unit-economics analysis
- Utilization, breakeven and efficient-scale thresholds
- Equipment and working-capital debt schedules
- Cash-reserve and investor-waterfall logic
- Integrated statements, KPIs and sensitivity outputs
CASE CONFIDENTIALITY
This anonymized case explains the forestry-service, deployment, fleet, staffing, transport, acquisition, financing, reserve and investor-return logic without naming the client, company, people, authorities, territories or dates. Exact equipment specifications and counts, rates, wages, utilization, costs, financing terms, ownership, reserve, waterfall, forecast and valuation assumptions remain private because client work can be confidential or NDA-protected. No source document, attachment, workbook screenshot, chart, formula, logo, equipment brand, product name, praise or identifying interface is reproduced. The illustration is an original fictional forestry-services operating system rather than a real fleet, site, deployment, acquisition, agency contract, client deliverable or outcome.