Connecting a multi-brand kitchen to channel and customer economics
An established restaurant operator was shaping a portfolio of owned and partner-led food brands around shared kitchens, physical locations and a direct-order app. An initial brand forecast needed to reflect dine-in activity, third-party marketplaces, membership behavior and the cash consequences of launch, inventory and debt.
Proprietary concepts and restaurant partnerships use distinct commercial logic before consolidation.
Customer acquisition, marketplace fees and contribution are visible by order source.
On-premise activity and off-premise orders share capacity but do not stack without limits.
Membership, repeat orders and customer lifetime determine a sustainable acquisition ceiling.
WHY THIS WASN’T A TEMPLATE EXERCISE
The model had to respect
how the business actually moved.
The reconstructed architecture connects brands to channels, app cohorts, locations and kitchens, cost of service, working capital and financing—so a direct-channel margin story can be tested against the customer-acquisition spend and operating load required to deliver it.
The brand forecast had lost the physical operation
Planning demand by brand made the portfolio easier to compare, but orders still had to pass through particular kitchens and locations. Without reconnecting the two, the forecast could exceed capacity while understating labor and occupancy costs.
Channels shifted demand rather than simply adding it
Dine-in, direct app orders and marketplace delivery competed for some of the same customers and production time. A reopening or a move toward direct ordering could change mix, fees and margin without creating the full amount as incremental revenue.
Better direct-order margin came with an acquisition bill
Avoiding marketplace fees looked attractive, but the operator then had to fund app adoption. Membership price alone could not set that budget; order frequency, contribution per order, retention and customer lifetime had to establish the maximum sustainable CAC.
Shared infrastructure created a hidden cash cycle
Several brands could reuse kitchens, staff and suppliers, yet launch costs, safety stock, payables, new-location spending and debt service still arrived on different schedules. Accounting profit therefore could not stand in for cash availability.
MODEL ARCHITECTURE
From operating activity
to a decision-ready view.
Each layer has one job. Together they keep the commercial story, unit economics and cash consequences on the same timeline.
Portfolio map
Owned and partner-led brands are separated by maturity and rollout timing, then translated into comparable order and revenue drivers.
Channel bridge
Dine-in, takeaway, direct app and third-party delivery volumes move through an explicit mix schedule with channel-specific fees and cannibalization.
Customer cohorts
Membership tiers, acquisition, order frequency, basket value, retention and contribution build lifetime economics and a supportable CAC threshold.
Kitchen capacity
Brand demand reconnects to locations, opening dates, kitchen throughput and service mix so growth cannot outrun the operating footprint.
Order contribution
Food cost, packaging, labor, payment and marketplace costs turn gross order value into comparable contribution by brand and channel.
Cash cycle
Launch spend, capital expenditure, inventory buffers, supplier terms and operating expenses explain when growth consumes cash before it contributes it.
Funding view
Debt schedules, capital structure, historical-versus-forecast reporting and scenario controls roll into a dashboard for runway and funding decisions.
WHAT THE ANALYSIS SURFACED
Useful answers,
without exposing client data.
The takeaways are intentionally qualitative. Exact assumptions, calculations and outputs remain inside the confidential client model.
Direct share was not the same as direct-channel value
Moving an order away from a marketplace can remove a fee, but it creates value only if incremental acquisition and retention costs stay below the contribution gained over the customer relationship.
Brand-level demand needed a location-level constraint
A portfolio can be planned by concept while food is produced by kitchens and teams. Linking demand back to throughput and opening schedules made growth operationally testable.
Dine-in recovery changed more than the sales mix
More on-premise activity can reduce delivery volume, marketplace exposure and packaging while increasing front-of-house demands. Those effects belong in one connected scenario rather than separate forecasts.
Working capital could move before profit did
Inventory buffers, supplier timing, launch costs and debt service could absorb cash ahead of the projected sales ramp. The funding decision therefore depended on monthly cash, not only the income statement.
MODELING APPROACH
The working system
behind the answer.
- Owned- and partner-brand rollout and revenue schedule
- Dine-in, direct-app and marketplace channel bridge
- Membership cohort, lifetime-value and CAC engine
- Location, kitchen-capacity and opening schedule
- Order-level food, packaging, labor and channel contribution
- Inventory, payables, launch-cost and capital-spending schedule
- Debt, capital structure, cash runway and scenario dashboard
CASE CONFIDENTIALITY
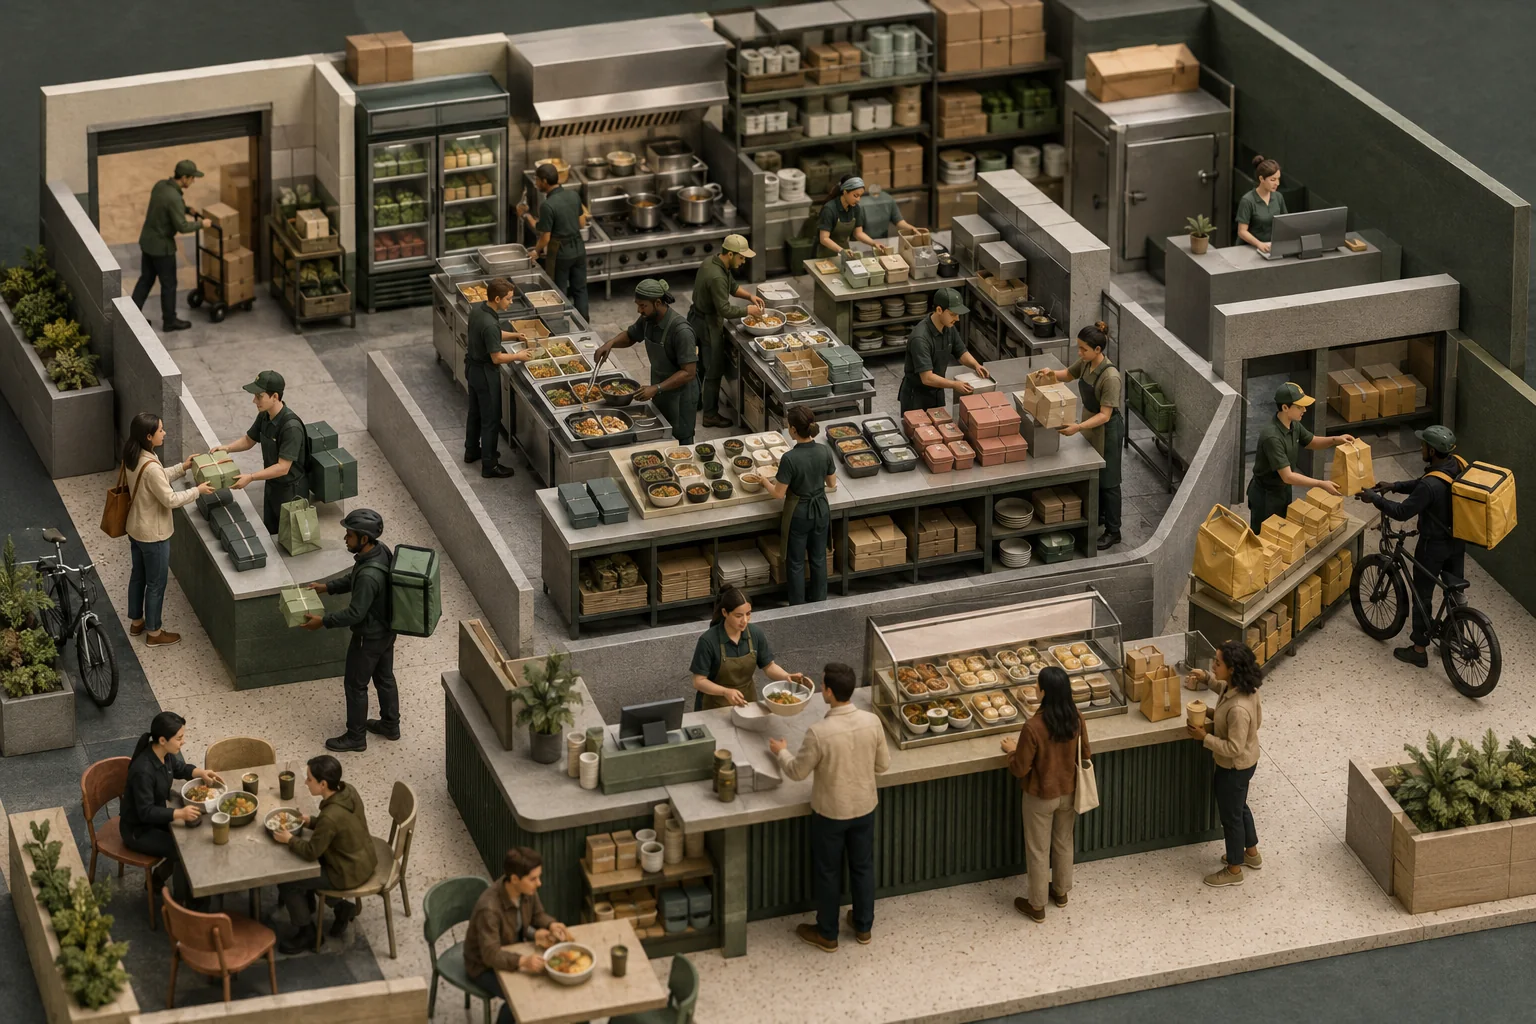
This anonymized case explains the multi-brand, channel, kitchen-capacity and customer-economics logic without naming the operator, founders, chefs, advisers, restaurants, food concepts, suppliers, delivery platforms, city, neighborhoods, locations or dates. Exact brand counts, outlet counts, order volumes, staffing, rollout schedule, membership tiers, prices, revenue targets, channel shares, customer-lifetime assumptions, costs, capital needs, loan programs, debt terms and historical results remain private because client engagements may be confidential or NDA-protected. The source decks, logos, maps, photographs, app concepts, formulas and exact outputs are not reproduced. The illustration is an original fictional shared-kitchen ecosystem rather than a real facility, brand portfolio or client workflow.