Balancing bulk inventory with subscription and give-back economics
A consumer hygiene brand was combining recurring household packs with one-off online and institutional orders. Its production quotes rewarded larger purchases, while every sale could also create a donated-product obligation, so the forecast had to connect catalog mix, channel margin, procurement batches and funding.
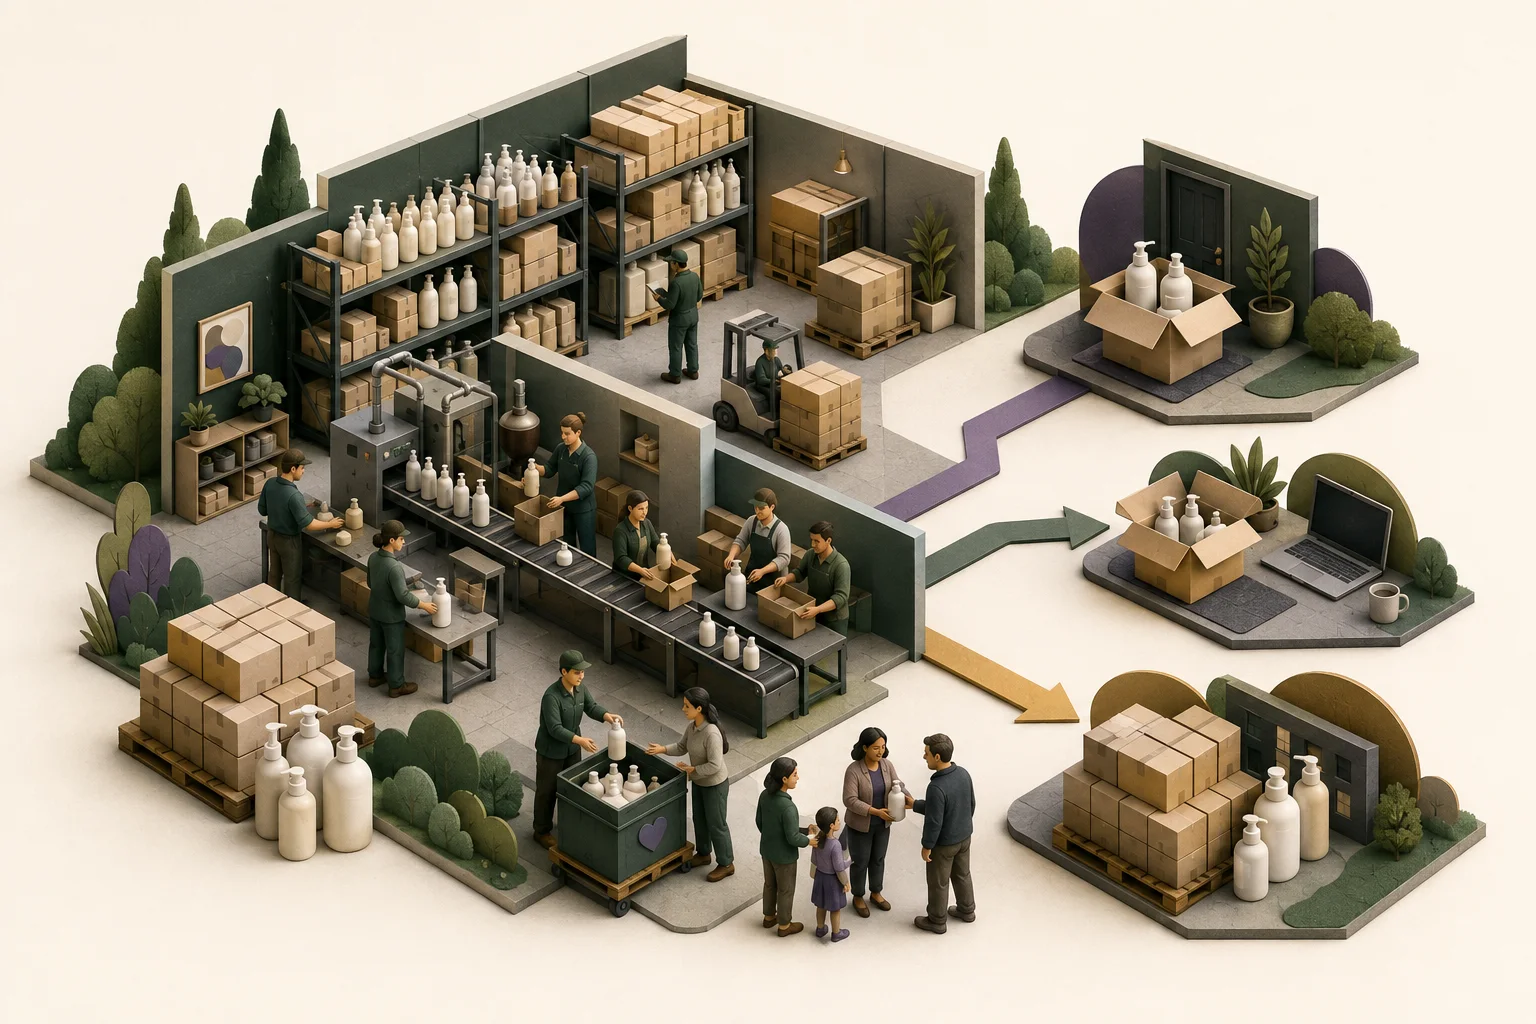
Replenishment plans and individual orders use separate volume, timing and retention drivers.
Household and institutional demand flow through different prices, costs and fulfillment rules.
Product packs, pallets and larger procurement tiers connect the catalog to unit cost and cash.
Commercial demand and the give-back commitment draw from the same production and inventory plan.
WHY THIS WASN’T A TEMPLATE EXERCISE
The model had to respect
how the business actually moved.
The reconstructed architecture translates product formats, sourcing options, order tiers, recurring and one-off demand, donated units and channel economics into a monthly inventory, margin and funding model.
One average product cost would hide the real catalog
Formats, pack configurations, sourcing routes and order tiers created different cost curves. The model needed a SKU-level master before it could produce a reliable blended margin.
Cheaper units could make the cash position worse
Larger production commitments reduced cost per unit but placed more cash into inventory before sell-through was known. Procurement savings therefore had to be compared with stock cover, timing and downside demand.
Recurring and one-off sales shared fulfillment, not revenue logic
Discounted replenishment plans depended on renewal and retention, while online and institutional orders followed separate volume patterns and channel costs. All three still competed for the same available stock.
The social promise changed both units and funding
A sale-linked give-back commitment created additional units to manufacture, hold and ship. Treating it as a fixed marketing line would understate fulfillment demand, while an unreconciled use-of-funds plan could leave the inventory ramp underfinanced.
MODEL ARCHITECTURE
From operating activity
to a decision-ready view.
Each layer has one job. Together they keep the commercial story, unit economics and cash consequences on the same timeline.
Catalog master
Product formats, pack sizes, sourcing choices, selling prices and channel availability sit in one controlled assumptions table.
Procurement tiers
Supplier order breaks, freight and handling translate each production batch into a landed unit cost and a cash commitment.
Subscription cohorts
New subscribers, replenishment cadence, discount, renewal, churn and average pack mix build recurring orders month by month.
One-off demand
Direct online purchases and institutional orders use separate customer, volume, price and payment assumptions.
Sold-and-donated units
The give-back ratio converts eligible commercial sales into additional product demand before inventory is rolled forward.
Channel contribution
Product cost, discounting, selling fees, payment and fulfillment turn gross sales into comparable contribution by route to market.
Inventory and funding
Purchases, lead times, stock cover, working capital and operating spend produce monthly cash, break-even and funding scenarios.
WHAT THE ANALYSIS SURFACED
Useful answers,
without exposing client data.
The takeaways are intentionally qualitative. Exact assumptions, calculations and outputs remain inside the confidential client model.
The lowest unit cost was not automatically the best purchase
A larger batch could improve gross margin while increasing cash exposure and leftover-stock risk. The useful comparison was landed savings versus the timing and confidence of sell-through.
Give-back behaved like variable product demand
When donation volume is tied to commercial activity, it rises with sales and consumes stock. Modeling the ratio alongside sold units keeps both the social commitment and its cost visible.
A subscription discount needed cohort support
Recurring revenue was valuable only when repeat behavior and contribution over the relationship offset the discount and recurring fulfillment cost. Sign-ups alone could not establish that value.
The funding need followed purchase timing, not a market-share slide
Batch deposits, lead times, inventory arrivals and sell-through determined the low point in cash. A reconciled use-of-funds schedule made the capital request traceable to those operating events.
MODELING APPROACH
The working system
behind the answer.
- SKU, pack and sourcing assumptions master
- Procurement-tier and landed-cost schedule
- Consumer subscription cohort forecast
- One-off consumer and institutional channel forecast
- Sold-and-donated unit fulfillment schedule
- Channel contribution and break-even analysis
- Inventory, working-capital, funding and use-of-funds dashboard
CASE CONFIDENTIALITY
This anonymized case explains the catalog, procurement, subscription, channel, give-back and funding logic without naming the company, founders, team, advisers, suppliers, factories, sales platforms, retailers, donation recipients, locations or dates. Exact product names, formulations, claims, formats, scents, origins, packs, production capacity, order volumes, prices, costs, discounts, market estimates, competitor comparisons, traction, media coverage, donation activity, fundraising terms, valuation and use of funds remain private because client engagements may be confidential or NDA-protected. The source cost tables, pitch slides, logos, product photographs, formulas and exact outputs are not reproduced. The illustration is an original fictional product operation rather than the client brand, facility, packaging or workflow.